Last Updated on July 14, 2022 by Jay
In this tutorial, we’ll learn exploratory data analysis (EDA) with a Python library called sweetviz.
Several alternative tools for EDA in Python:
- Pandas Profiling
- Sweetviz
- Pandas Gui
- DTale
Let’s pip install the sweetviz library:
pip install sweetvizJupyter Notebook is a nice coding environment for exploratory data analysis. We can display the data visualization alongside our code to make coding changes much easier than using other IDE.
Learn how to set up Jupyter Notebook and virtual environment here.
Data
We are going to use the gapminder dataset which contains years and life expectancy for countries around the world.
import plotly.express as px

df = px.data.gapminder()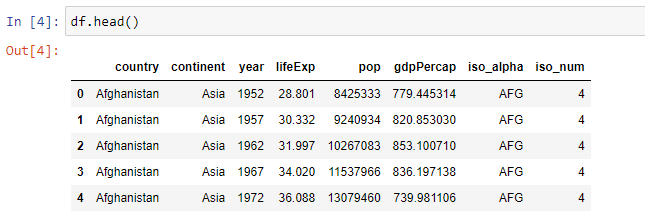
Exploratory Data Analysis
import sweetviz as sv

result = sv.analyze(df)
result.show_notebook()
After a few seconds, the results will show up in the Jupyter Notebook.
On the top, we have a quick summary of the dataset. Number of rows, columns, type of variables, whether the dataset contains duplicates, etc.

Below the summary section, we’ll find details on each variable (column) in the dataset. Clicking on a variable will expand that section with more details.

Associations / Correlation analysis
One cool feature about sweetviz is the “Associations”. Once we click on the ASSOCIATIONS button in the summary section, the below matrix will show up.


Squares represent categorical variables (text), and circles represent numerical correlations. The trivial diagonal is left empty on purpose (because they will always be 1).
The ROW label values indicate how much information they provide to each variable on the TOP. For example, in our dataset, “continent”, “year” and “gpdPercap” give the most information on “lifeExp”.
To view the exact correlation coefficient ratios, simply click on each variable, and we can find the coefficients there.

Compare datasets
Another very cool feature about sweetviz is the ability to compare two datasets side by side. Let’s choose two subsets from our data gapminder datasets, then compare them. Note in the .compare() method, we pass in two lists, each contains the dataframe itself (e.g. df_1), and the dataset name in string value (e.g. “2007”).
df_1 = df[df['year']==2007]
df_2 = df[df['year']==2002]

compare = sv.compare([df_1,"2007"],[df_2, "2002"])
compare.show_notebook()
Generate EDA Reports In Non-Notebook Environment
If you prefer to use a coding environment other than a notebook, that’s totally fine. We just need to modify the last line of code to .show_html(). We can even put a file path inside this method, and a report will be saved to that location.
compare.show_html(r'C:\MyComputer\output.html')